10.3. BSM Details Page
Click on the SLA name from index page to go to details page. You can view all the details of SLA i.e. Monitor Status, KPI status, KPI Details with histogram on details page.
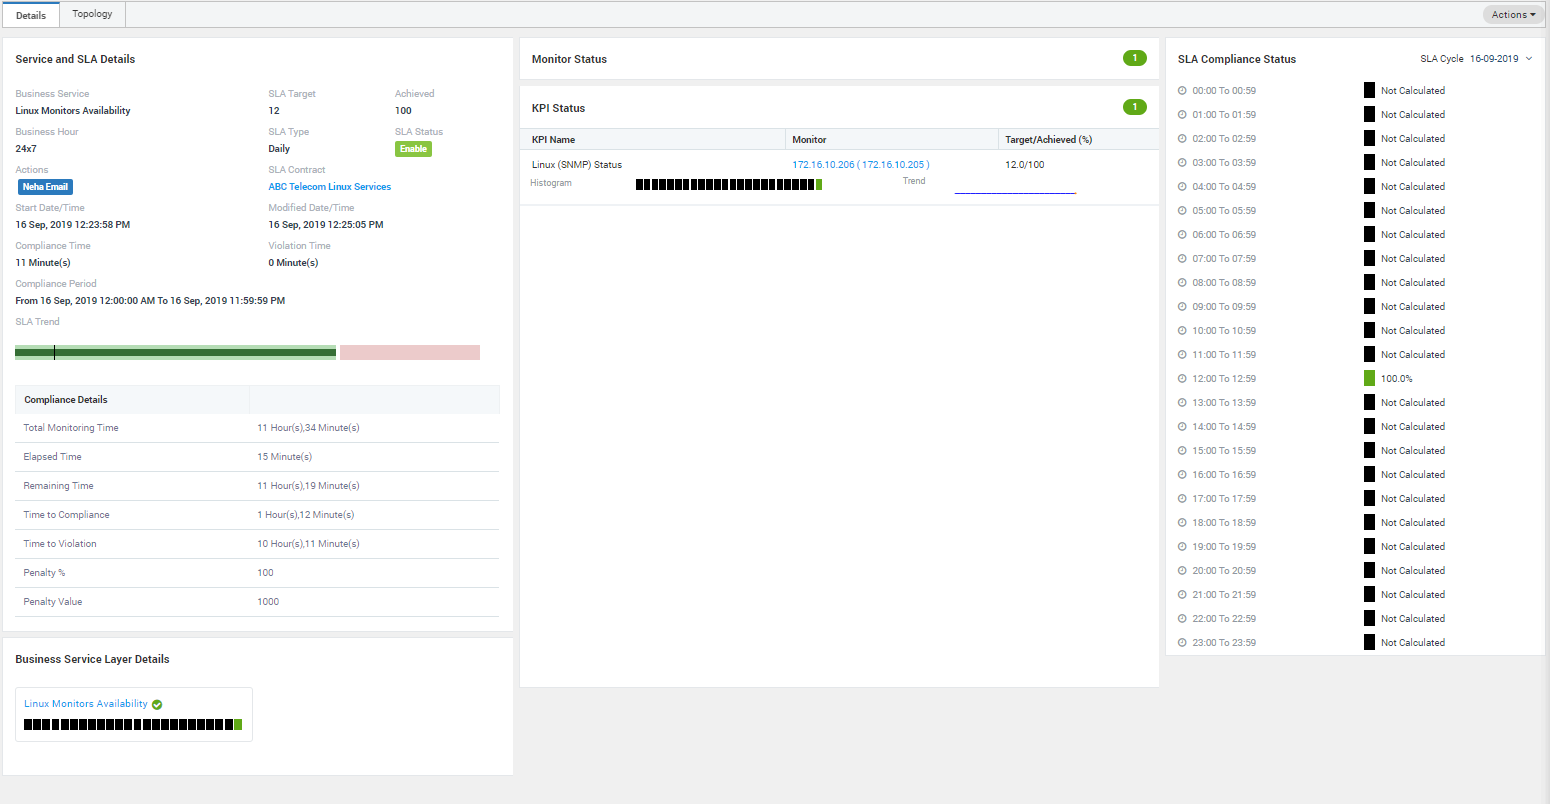
BSM Details Page
Service and SLA Details
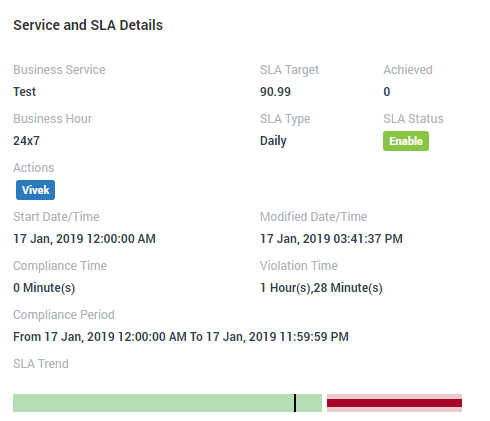
Service and SLA Details
Business Service |
Display name of the SLA |
SLA Target |
The target value SLA should achieve to prevent violation |
Achieved |
Percentage of SLA (%) achieved |
Business Hour |
Business hours in the day for which SLA runs |
SLA Type |
Time period of one complete cycle of SLA |
SLA Status |
Status of the SLA (Enable/Disable) |
Actions |
Name of the actions associated with SLA |
Start Date/Time |
Date and time when SLA started |
Modified Date/Time |
Date and time when SLA configuration is changed |
Compliance Time |
Total time for which SLA complied |
Violation Time |
Total time for which SLA didn’t complied |
Compliance Period |
Start date/time and end date/time of SLA |
SLA Trend |
Graphical representation of SLA is clear and violated |
Penalty (%) |
Shows the percentage of penalty applied when SLA is violated |
Penalty Value |
Shows the price vendor has to pay when SLA is violated |
Additional Read: Click here to download SLA calculation formulas.
Compliance Details
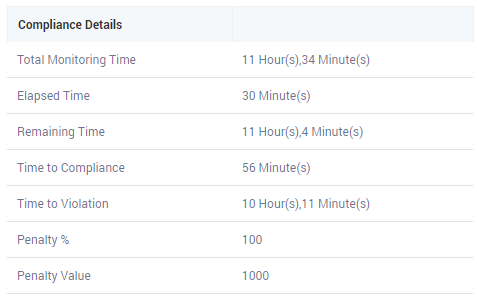
Compliance Details
Compliance details are the time computation for SLA. Please download above document for field description and formulas used to compute them.
Business Service Layer Details
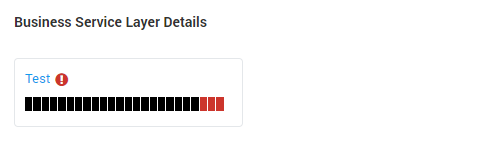
Business Service Layer Details
The section shows all the BSM(s) (parent and child) in this section. You can create a Nested Business service views for more complex business services running in enterprise network. In order to do this, you should first create low level business service and then add all the low business service into a new higher level business service. Parent SLA’s Health severity depends on Child SLAs severity, KPI details and health trend.
Monitors
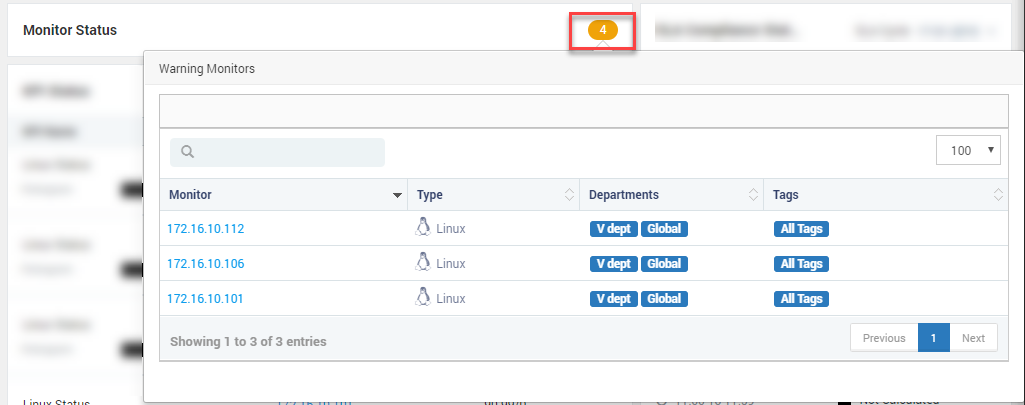
Monitors in SLA
The section shows all the monitors that are not in clear state and can result in SLA violation. Click on the number to see the details of the monitors.
KPI Status
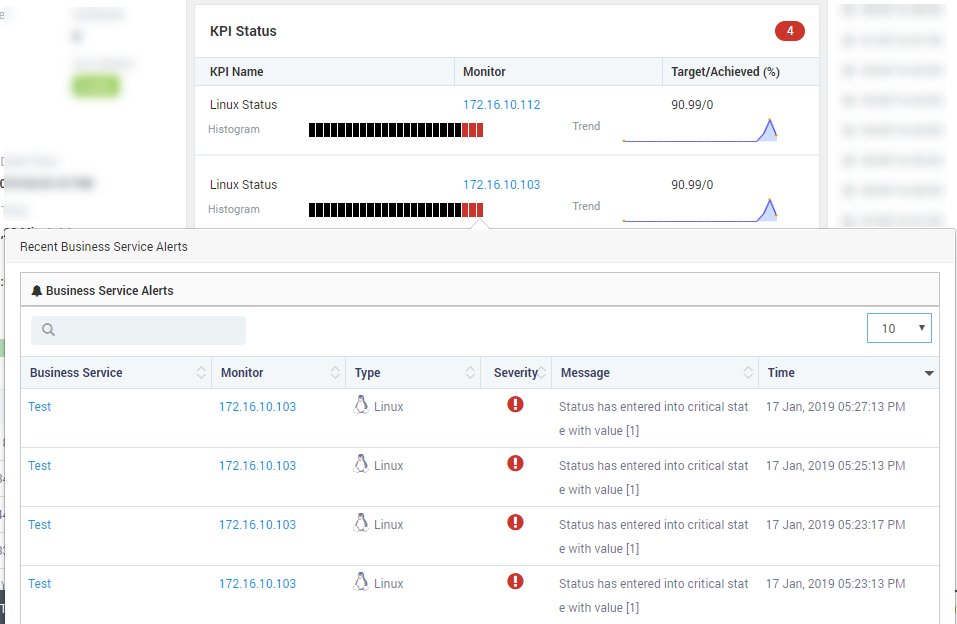
KPI Status
The section shows the performance of monitors for each KPI. If any of the monitor in the KPI doesn’t meet the threshold, the KPI will show in critical state. The bar of each KPI shows the KPI status of last 24 hours. Click on any bar to see the monitors under that KPI.
SLA Compliance Status
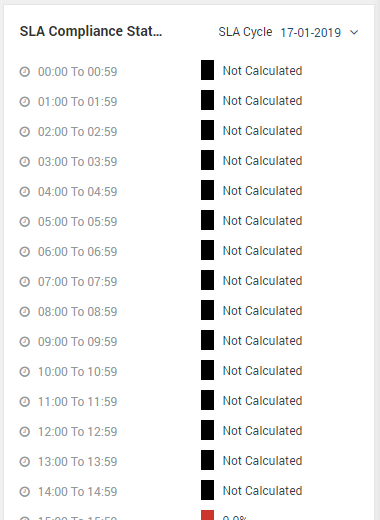
SLA Compliance Status
The list shows the compliance status based on the SLA type. See the next section for details. To see the compliance status of past days, select the cycle from top right corner. When you’ll export the SLA in a report, the report will show the cycle you have selected.
Actions
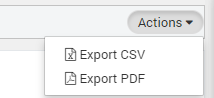
Export SLA in CSV or PDF
Click on Actions button to download the the SLA information in CSV or PDF format. The output report will show the SLA of the selected cycle. However in the report, there will be some fields that will show live data and some will show data of selected SLA. Following fields show data of selected SLA cycle:
Target Achieved (%)
Total Monitoring Time
Elapsed Time
Remaining Time
Compliance Time
Violation Time
Time In Compliance
Time In Violation
Compliance Period
SLA State